Graphite Series #4: Graphite Webapp
In the Graphite Series blog posts, I'll provide a guide to help through all of the steps involved in setting up a monitoring and alerting system using a Graphite stack. Disclaimer: I am no expert, I am just trying to help the Graphite community by providing more detailed documentation. If there's something wrong, please comment below or drop me an email at feangulo@yaipan.com.
Now that we have the back-end components up and running and storing numeric time-series data in the formats that we have specified, it's time to take a look at the front-end components of Graphite. Specifically, we need a way to query and visualize the information that is stored.
The Graphite Webapp
The Graphite web application is a Django application that runs under Apache/mod_wsgi, according to the Github readme file. In general, it provides the following:
- a URL-based API endpoint to retrieve raw data and generate graphs
- a user interface to navigate metrics and build and save dashboards
The Installation Maze
The installation of graphite-web is really a maze. I have installed it multiple times - in RHEL, CentOS, Ubuntu and Mac OS X - and every time the steps have been different. Treat it as a game, enjoy it, and you'll know that you've completed the maze when all the required dependencies have been installed.
Instructions for RHEL 6.5:
# cd /tmp
# git clone https://github.com/graphite-project/graphite-web.git
# cd /tmp/graphite-web
# python check-dependencies.py
[REQUIRED] Unable to import the 'django' module, do you have Django installed for python 2.6.6?
[REQUIRED] Unable to import the 'pyparsing' module, do you have pyparsing module installed for python 2.6.6?
[REQUIRED] Unable to import the 'tagging' module, do you have django-tagging installed for python 2.6.6?
[OPTIONAL] Unable to import the 'memcache' module, do you have python-memcached installed for python 2.6.6? This feature is not required but greatly improves performance.
[OPTIONAL] Unable to import the 'txamqp' module, this is required if you want to use AMQP as an input to Carbon. Note that txamqp requires python 2.5 or greater.
[OPTIONAL] Unable to import the 'python-rrdtool' module, this is required for reading RRD.
3 optional dependencies not met. Please consider the optional items before proceeding.
3 necessary dependencies not met. Graphite will not function until these dependencies are fulfilled.
The goal is to install at least all of the required dependencies. Install the optional dependencies if you're planning on using the AMQ functionality or the caching functionality using Memcache.
# sudo yum install cairo-devel
# sudo yum install pycairo-devel
# sudo pip install django
# sudo pip install pyparsing
# sudo pip install django-tagging
# sudo pip install python-memcached
# sudo pip install txamqp
# sudo pip install pytz
# cd /tmp/graphite-web
# python check-dependencies.py
[OPTIONAL] Unable to import the 'python-rrdtool' module, this is required for reading RRD.
1 optional dependencies not met. Please consider the optional items before proceeding.
All necessary dependencies are met.
I've installed enough packages to meet the required dependencies. Therefore, I win! I can now install graphite-web:
# cd /tmp/graphite-web # sudo python setup.py install # ls -l /opt/graphite/webapp/ total 12 drwxr-xr-x. 6 root root 4096 May 23 14:33 content drwxr-xr-x. 15 root root 4096 May 23 14:33 graphite r--r--. 1 root root 280 May 23 14:33 graphite_web-0.10.0_alphainfo
The setup script moves the web application files to the proper location under /opt/graphite/webapp.
Initialize the Database
The web application maintains an internal database to store user information and dashboards. Initialize the database by running the following:
# cd /opt/graphite
# export PYTHONPATH=$PYTHONPATH:`pwd`/webapp
# django-admin.py syncdb --settings=graphite.settings
You just installed Django's auth system, which means you don't have any superusers defined.
Would you like to create one now? (yes/no): yes
Username (leave blank to use 'root'): feangulo
Email address: feangulo@yaipan.com
Password:
Password (again):
Error: Blank passwords aren't allowed.
Password:
Password (again):
Superuser created successfully.
Installing custom SQL ...
Installing indexes ...
Installed 0 object(s) from 0 fixture(s)
This will create a new database and store it in the /opt/graphite/storage directory:
# ls -l /opt/graphite/storage/graphite.db r--r--. 1 root root 74752 May 23 14:46 /opt/graphite/storage/graphite.db
Graphite Webapp Settings
The configuration file containing the graphite-webapp settings is located in the /opt/graphite/webapp/graphite folder. Copy the sample configuration file:
# cd /opt/graphite/webapp/graphite
# cp local_settings.py.example local_settings.py
I make some customizations to my settings:
# vi /opt/graphite/webapp/graphite/local_settings.py
#########################
# General Configuration #
#########################
TIME_ZONE = 'UTC'
##########################
# Database Configuration #
##########################
DATABASES = {
    'default': {
        'NAME': '/opt/graphite/storage/graphite.db',
        'ENGINE': 'django.db.backends.sqlite3',
        'USER': '',
        'PASSWORD': '',
        'HOST': '',
        'PORT': ''
    }
}
At this point, if you followed the instructions in the previous posts, you should only have one carbon-cache process running on port 2003 with a query port on 7002. These are the defaults expected by the graphite-webapp. Therefore, there are no other changes required to the configuration file at this point.
# ps cache 1 S root 14101 1 0 80 0 cache.py start # netstat -nap | grep 2003 tcp 0 0 0.0.0.0:2003 0.0.0.0:* LISTEN 14101/python # netstat -nap | grep 7002 tcp 0 0 0.0.0.0:7002 0.0.0.0:* LISTEN 14101/python
However, you could specify the carbon-cache process to read from explicitly in the settings file:
# vi /opt/graphite/webapp/graphite/local_settings.py
#########################
# Cluster Configuration #
#########################
CARBONLINK_HOSTS = ["127.0.0.1:7002:a"]
NOTE: This means that I have a carbon-cache process running locally, with the query port set to 7002 and the name set to 'a' - the default is no name is specified in the configuration file. If you look at the Carbon configuration file, you should see something like this:
# vi /opt/graphite/conf/carbon.conf
[cache]
LINE_RECEIVER_INTERFACE = 0.0.0.0
LINE_RECEIVER_PORT = 2003
CACHE_QUERY_INTERFACE = 0.0.0.0
CACHE_QUERY_PORT = 7002
Dashboard and Graph Template Configuration
The graphite webapp comes with dashboard and graph template defaults. Copy the sample configuration files:
# cd /opt/graphite/conf
# cp dashboard.conf.example dashboard.conf
# cp graphTemplates.conf.example graphTemplates.conf
I modify the dashboard configuration file to have larger graph tiles.
# vi /opt/graphite/conf/dashboard.conf
[ui]
default_graph_width = 500
default_graph_height = 400
automatic_variants = true
refresh_interval = 60
autocomplete_delay = 375
merge_hover_delay = 750
I modify the default graph template to have a black background and a white foreground. I also like the font to be smaller.
# vi /opt/graphite/conf/graphTemplates.conf
[default]
background = black
foreground = white
minorLine = grey
majorLine = rose
lineColors = blue,green,red,purple,brown,yellow,aqua,grey,magenta,pink,gold,rose
fontName = Sans
fontSize = 9
fontBold = False
fontItalic = False
Run the Web Application
We are finally ready to run the web application. I'm going to run it on port 8085 but you may set the port to any value you'd like. Run the following commands:
# cd /opt/graphite # PYTHONPATH=`pwd`/storage/whisper ./bin/run-graphite-devel-server.py --libs=`pwd`/webapp /opt/graphite 1>/opt/graphite/storage/log/webapp/process.log 2>&1 & # tail -f /opt/graphite/storage/log/webapp/process.log
Open a web browser and point it to http://your-ip:8085. Make sure that the Graphite web application loads. If you're tailing the process.log file, you should be able to see any resources that are loaded and any queries that are made from the web application.
Navigate the Metrics
In a previous blog post, we had published a couple of metrics to the carbon-cache using the netcat command. Specifically, we had published the following:
carbon.agents.graphite-tutorial.metricsReceived
carbon.agents.graphite-tutorial.creates
PRODUCTION.host.graphite-tutorial.responseTime.p95
The web application displays metrics as a tree. If you navigate the metric tree in the left panel, you should be able to see all of these metrics.
You may click on any metric and it will be graphed (past 24 hours by default) in the panel on the right. To change the date range to query, use the buttons in the panel above the graph.
Create a Dashboard
The default view is great to quickly browse metrics and visualize them. But if you want to build a dashboard, point your browser to http://your-ip:8085/dashboard. The top portion of the page is another way to navigate your metrics. You can either click on the options to navigate, or start typing to get suggestions. You can click on a metric and a graph tile will appear in the bottom section. As you keep clicking on new metrics, additional tiles appear in the panel below thereby creating a dashboard. At times you might want to display multiple metrics in a single graph. To do this, drag and drop a tile on top of another one and the metrics will be graphed together. You may also change the position of the tiles in the layout by dragging them around.
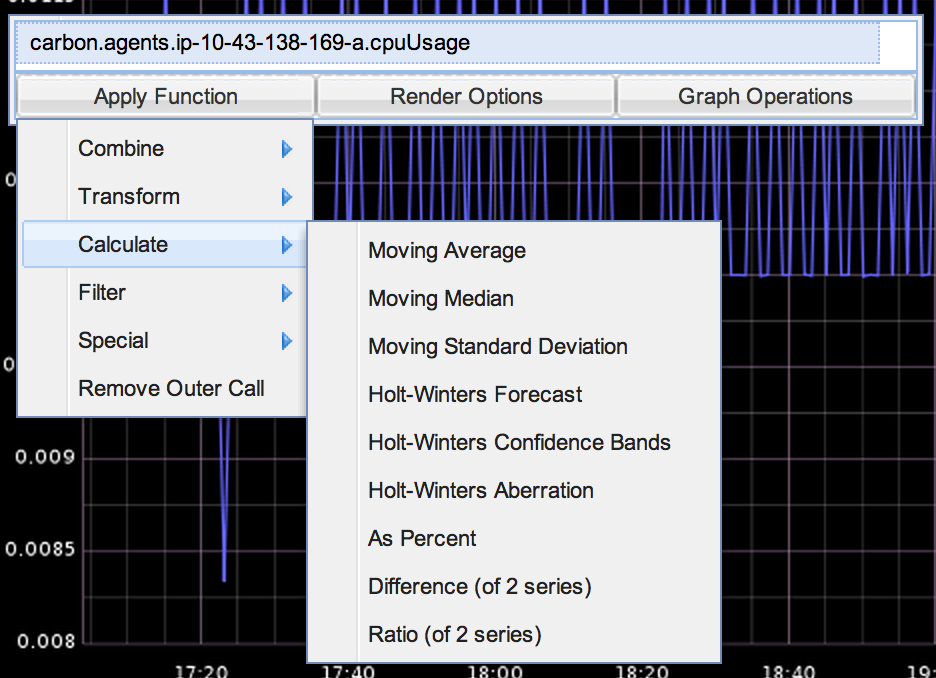
The user interface looks very simple, but don't be discouraged. You can do very powerful operations on your metric data. If you click on one of the graph tiles, you will get a dialog. It displays the list of metrics being graphed and you may edit them directly. There are also multiple menus in the dialog to apply functions on the data, change aspects of the visualization, and many other operations.


You may also configure and save your dashboard, load other dashboards, change the date range of the current dashboard, share a dashboard, among other things, using the top-most menu. By far my favorite thing is the Dashboard -> Edit Dashboard feature. It saves me a lot of time when I need to create or modify dashboards.
To illustrate, I am going to build a dashboard to monitor the carbon-cache process. As mentioned in a previous blog post, Carbon processes report internal metrics. I don't like to build dashboards manually, instead I will use the Edit Dashboard feature - my favorite!
To build a dashboard to monitor the carbon-cache process, specify the following in the Edit Dashboard window.
NOTE: This dashboard will monitor all carbon-cache processes that you have running. Notice the use of the asterisk (*) in the metric name to match all values following the carbon.agents prefix.
[
  {
    "target": [
      "aliasByNode(carbon.agents.*.metricsReceived,2)"
    ],
    "title": "Carbon Caches - Metrics Received"
  },
  {
    "target": [
      "aliasByNode(carbon.agents.*.creates,2)"
    ],
    "title": "Carbon Caches - Create Operations"
  },
  {
    "target": [
      "aliasByNode(carbon.agents.*.cpuUsage,2)"
    ],
    "title": "Carbon Caches - CPU Usage"
  },
  {
    "target": [
      "aliasByNode(carbon.agents.*.memUsage,2)"
    ],
    "title": "Carbon Caches - Memory Usage"
  },
  {
    "target": [
      "aliasByNode(carbon.agents.*.updateOperations,2)"
    ],
    "title": "Carbon Caches - Update Operations"
  },
  {
    "target": [
      "aliasByNode(carbon.agents.*.pointsPerUpdate,2)"
    ],
    "title": "Carbon Caches - Points per Update"
  },
  {
    "target": [
      "aliasByNode(carbon.agents.*.avgUpdateTime,2)"
    ],
    "title": "Carbon Caches - Average Update Time"
  },
  {
    "target": [
      "aliasByNode(carbon.agents.*.committedPoints,2)"
    ],
    "title": "Carbon Caches - Committed Points"
  },
  {
    "target": [
      "aliasByNode(carbon.agents.*.errors,2)"
    ],
    "title": "Carbon Caches - Errors"
  },
  {
    "target": [
      "aliasByNode(carbon.agents.*.cache.size,2)"
    ],
    "title": "Carbon Caches - Cache Size"
  },
  {
    "target": [
      "aliasByNode(carbon.agents.*.cache.queues,2)"
    ],
    "title": "Carbon Caches - Cache Queues"
  },
  {
    "target": [
      "aliasByNode(carbon.agents.*.cache.overflow,2)"
    ],
    "title": "Carbon Caches - Cache Overflow"
  },
  {
    "target": [
      "aliasByNode(carbon.agents.*.cache.queries,2)"
    ],
    "title": "Carbon Caches - Cache Queries"
  },
  {
    "target": [
      "aliasByNode(carbon.agents.*.cache.bulk_queries,2)"
    ],
    "title": "Carbon Caches - Cache Bulk Queries"
  }
]
Update the dashboard definition and you should now see something like this:
Changing content in the Edit Dashboard dialog updates the dashboard on the browser. However, it does not save it to Graphite's internal database of dashboards. Go ahead and save the dashboard so that you can share it and open it up later.
To look up the dashboard, open the Finder:
On a production Graphite installation, the Graphite Caches dashboard would look more like this:
Using Graphlot
The dashboard graphs are beautiful, but you sometimes need to dig a little deeper. If I have multiple lines in a graph, I might want to hover over the line and get the value at that point in time. For stuff like that, there exists Graphlot. Point your browser to http://your-ip:8085/graphlot. Type in the metrics that you'd like to investigate into the form and modify the time range. You should end up with an interactive graph in which you can hover over a line to get information about the corresponding metric and the value at that point in time.
This Graphlot feature was great before Grafana existed! In a future post, I'll cover the Grafana tool.
It's all about the functions
People might complain about Graphite a lot: it doesn't scale well, the storage mechanism isn't the most optimal - but you have to accept the fact that Graphite's API is a beauty. Having a user interface is fancy, but don't forget that whatever you can do through the UI, you can also do by making graphite-web API requests. Users are able to request custom graphs by building a simple URL. The parameters are specified in the query string of the HTTP GET request. By default a PNG image is returned as the response, but the user may also indicate the required format of the response - for example, JSON data.
Sample request #1:
- Metric: CPU usage of all carbon-cache processes
- Graph dimensions: 500x300
- Time range: 12 hours ago until 5 minutes ago
- Response format: PNG image (default)
http://your-ip:8085/render?target=carbon.agents.*.cpuUsage&width=500&height=300&from=-12h&until=-5min
Sample request #2:
- Metric: CPU usage of all carbon-cache processes
- Graph dimensions: 500x300
- Time range: 12 hours ago until 5 minutes ago
- Response format: JSON data
http://your-ip:8085/render?target=carbon.agents.*.cpuUsage&width=500&height=300&from=-12h&until=-5min&format=json
Graphite's API supports a wide variety of display options as well as data manipulation functions that follow a simple functional syntax. Functions can be nested, allowing for complex expressions and calculations. View the online documentation to peruse all of the available functions:
- Graphite Functions: http://graphite.readthedocs.org/en/latest/functions.html
Functions example on the p95 latency of all hosts:
- averageSeries: computes the average of all the values in the set
- We want to see the average among all the p95 latencies
- scale: multiply a value by a constant
- The latencies are reported in milliseconds, but we want to display them in seconds
- alias: change the name of the metric when displaying
- Instead of the full metric name, we want to display only avg p95 in the graph legend
alias(scale(averageSeries(PRODUCTION.host.*.requests.p95),0.001),'avg p95')
Metric Publishing Intervals
In a previous blog post, I went through the exercise of configuring the storage schemas and storage aggregations for the Whisper files in which the data points are stored. Now that we have a way to visualize data, we can verify that the metrics are getting stored like we intended them to. For simplicity, let's look at the internal metrics processed by the carbon-cache process.
Sample request #1:
- Metric: CPU usage of all carbon-cache processes
- Graph dimensions: 500x300
- Time range: 15 minutes ago until 10 minutes ago
- Response format: PNG image (default)
http://your-ip:8085/render?target=carbon.agents.*.cpuUsage&width=500&height=300&from=-15min&until=-10min
We can clearly see that the rendered graph has five data points, one every minute. This matches our Whisper storage schema configuration for metrics starting with carbon. We had specified that these types of metrics are published every minute and that they should be retained for 180 days before getting rolled up to 10 minute data.
[carbon]
pattern = ^carbon\.
retentions = 1min:180d,10min:180d
Just to make sure, let's make the same request but change the response format to JSON.
Sample request #2:
- Metric: CPU usage of all carbon-cache processes
- Time range: 15 minutes ago until 10 minutes ago
- Response format: JSON data
http://your-ip:8085/render?target=carbon.agents.*.cpuUsage&from=-15min&until=-10min&format=json
[{"target": "carbon.agents.ip-10-43-138-169-a.cpuUsage",
  "datapoints": [
   [0.0099983003179772295, 1400946420],
   [0.01166495819015459, 1400946480],
   [0.011676197879629324, 1400946540],
   [0.011662787363860038, 1400946600],
   [0.011656008932948525, 1400946660]
  ]
}]
We queried a five minute interval and received five data points in the response. It seems to be working perfectly!
NOTE: I am assuming that you haven't changed the default metric publishing interval for Carbon metrics of 60 seconds.
[cache]
# By default, carbon itself will log statistics (such as a count,
# metricsReceived) with the top level prefix of 'carbon' at an interval of 60
# seconds. Set CARBON_METRIC_INTERVAL to 0 to disable instrumentation
# CARBON_METRIC_PREFIX = carbon
# CARBON_METRIC_INTERVAL = 60
According to the storage schema configuration entry, any data points past 180 days will be rolled up into 10-minute data points. If you had enough historic data, the following request would query for data more than 180 days in the past and the result would consist of rolled up 10-minute data points.
Sample request #3:
- Metric: CPU usage of all carbon-cache processes
- Time range: 259300 minutes ago until 259250 minutes ago
- Response format: JSON data
http://your-ip:8085/render?target=carbon.agents.*.cpuUsage&from=-259300min&until=-259250min&format=json
Wrap Up
Congratulations! We have installed and configured the graphite-webapp, navigated metrics and built a dashboard. You can now build your own awesome dashboards for your business and application metrics.